Monterey Peninsula Real Estate Blog

Information about Monterey Peninsula Real Estate including new MLS Real Estate Listings by the Monterey Peninsula Home Team. You will see posts about Monterey Peninsula cities including Monterey, Pacific Grove, Pebble Beach, Carmel, Carmel Valley, Seaside, Marina and the HWY 68 Corridor.  These posts will have stories and information about local issues including real estate, news, and other helpful information, plus anything else we want to write about ;-).


Aug. 19, 2013

How Skyline Forest Grew: Monterey’s Expansion into the Wooded Ridgeline

Originally published August 19, 2013; substantially updated September 2026.

From downtown Monterey, the wooded ridge above the city can look as though it has always been there untouched.

It hasn't.

Hidden among the Monterey pines and coast live oaks is one of the city's most interesting examples of postwar residential growth: Skyline Forest.

Unlike Old Town, New Monterey or Peter's Gate, Skyline Forest is not a neighborhood whose origins reach back to Monterey's Spanish, Mexican or early resort eras. Most of the neighborhood took shape during the second half of the twentieth century, when Monterey was expanding into land that had previously remained largely forested and sparsely developed.

Beginning in the 1960s, subdivision roads climbed into the ridge. Houses appeared among the trees. Some were designed around panoramic views of Monterey Bay; others looked inward toward the forest.

But something else happened at nearly the same time.

As development reached the upper slopes, Monterey increasingly recognized that the wooded ridge itself was part of the city's identity. The forest was not simply vacant land waiting to be developed. It formed the visual backdrop behind Monterey.

The result is the Skyline Forest we see today: a residential neighborhood created during Monterey's postwar growth but shaped ever since by an ongoing effort to balance homes, views, trees, greenbelts and the preservation of the city's forested skyline.

If you are researching current homes rather than neighborhood history, visit our complete guide to Skyline Forest & Skyline Ridge real estate.

Where Is Skyline Forest?

Skyline Forest occupies the wooded upper slopes above central Monterey along and near Skyline Drive, Skyline Forest Drive and Holman Highway/Highway 68.

The neighborhood sits near one of the highest portions of incorporated Monterey.

Below it lie the older residential neighborhoods and downtown Monterey. To the west is the Del Monte Forest and Pebble Beach. To the north are Veterans Memorial Park and Huckleberry Hill Nature Preserve.

The location gives Skyline Forest an unusual geographic identity.

It is unquestionably part of the City of Monterey, yet portions of the neighborhood feel more like the forested interior of the Peninsula than the coastal city visible below.

Before Skyline Forest

For most of Monterey's early history, the ridge above the city remained outside the center of residential development.

Monterey grew first around its harbor, presidio, adobes and commercial core.

Later expansion created neighborhoods such as New Monterey, Peter's Gate, Monterey Vista and Alta Mesa.

The wooded upper ridge was more difficult to develop.

Its slopes, forest and elevation made road construction and utilities more complicated than development on flatter land. At the same time, its height made the area increasingly attractive as automobile ownership and modern engineering made hillside neighborhoods practical.

By the middle of the twentieth century, the ridge represented something Monterey had not previously needed in large quantities: land for continued suburban residential expansion.

Postwar Monterey Needed More Housing

The growth of Skyline Forest cannot be separated from the enormous changes occurring throughout the Monterey Peninsula after World War II.

Military activity had transformed the region during the war. The Naval Postgraduate School moved to Monterey in 1951. Fort Ord remained one of the largest military installations on the Central Coast. Tourism was expanding, and new businesses and institutions were creating additional employment.

At the same time, Americans were changing how they thought about housing.

The postwar ideal increasingly emphasized:

  • detached single-family homes
  • larger residential lots
  • private automobiles
  • attached garages
  • indoor-outdoor living
  • distance from commercial districts
  • views and natural surroundings

That development pattern was very different from Monterey's nineteenth-century neighborhoods, where smaller lots and walkable street grids had been common.

Skyline Forest was well suited to the new model.

Development Reaches Monterey's Upper Ridge

By the mid-1960s, development of the Skyline area was clearly underway.

One revealing City record comes from 1966, when Monterey created the Skyline Forest Service District.

The district was established to provide permanent landscape maintenance within the Skyline Forest area, with participating properties funding that work through a special tax.

That is significant because it shows that Skyline Forest was being conceived as more than a collection of isolated hillside houses.

Landscaping, roads and neighborhood maintenance were becoming part of an organized residential environment.

Skyline Crest – 1967

Subdivision records provide another useful marker.

Skyline Crest No. 1, Tract 562 was recorded in Monterey County on December 13, 1967.

Homes in Skyline Crest were being constructed almost immediately afterward, with properties dating from 1968.

Skyline Crest differed from many nearby detached-home subdivisions because it introduced a denser attached or condominium-style residential pattern into the ridge.

The development demonstrates that planners and builders were experimenting with more than one housing model as Monterey expanded upward.

The Skyline Forest Subdivisions

Skyline Forest itself developed through a series of subdivision tracts rather than one massive project built all at once.

Property records still preserve names such as:

  • Skyline Forest No. 1
  • Skyline Forest No. 7
  • Skyline Crest No. 1

Those old tract names appear today in legal descriptions even though buyers generally think of the entire area simply as Skyline Forest or Skyline Forest/Skyline Ridge.

The staggered subdivision process helps explain why architecture and street character vary throughout the neighborhood.

Skyline Forest No. 1

One of the important early residential tracts was Skyline Forest No. 1, Tract 485.

Homes associated with this tract date from the late 1960s and early 1970s.

Properties on streets such as Shepherds Place and Forest Vale Place illustrate the type of development appearing during this period: detached houses on wooded lots, frequently around a quarter acre or larger, with garages and floor plans designed for automobile-oriented suburban living.

The forest was not removed completely to create a conventional tract landscape.

Instead, homes were inserted among existing trees.

That distinction became central to Skyline Forest's identity.

Skyline Forest No. 7 – 1971

Residential expansion continued into the 1970s.

County records show Skyline Forest No. 7, Tract 639 was recorded on August 18, 1971.

Properties within that tract include homes around Overlook Place and other upper portions of the neighborhood.

Construction continued throughout the decade.

Some later streets and individual homes were not completed until the 1980s or beyond, but the 1960s and 1970s established the neighborhood's strongest architectural identity.

Why So Many Skyline Forest Homes Look Mid-Century

Skyline Forest developed during an important period in California residential architecture.

Builders and architects were increasingly interested in houses that responded to their sites rather than simply sitting on them.

That philosophy was particularly useful on Monterey's wooded slopes.

Homes built during the period commonly incorporated:

  • low horizontal rooflines
  • California ranch influences
  • split-level construction
  • open-beam ceilings
  • large expanses of glass
  • natural wood and stone
  • decks facing Monterey Bay
  • living rooms oriented toward views
  • floor plans that followed sloping terrain

Not every Skyline Forest home is architecturally significant, and the neighborhood was built by many different owners and builders.

But the development era is unmistakable.

Building Houses Around the View

Elevation changed the way houses could be designed.

Older Monterey neighborhoods often developed around streets, sidewalks and proximity to commercial areas.

In Skyline Forest, the orientation of an individual lot could be just as important as the street itself.

Builders began positioning principal living areas toward:

  • Monterey Bay
  • Del Monte Beach
  • downtown Monterey
  • Seaside and Marina
  • distant mountains
  • forest and canyon views

Large windows and elevated decks helped make the landscape part of the house.

This relationship between architecture and view remains one of the strongest characteristics of Skyline Forest real estate today.

Not Every Skyline Forest Home Faces Monterey Bay

The name can create a misleading assumption that every house on the ridge has a panoramic water view.

They do not.

Some homes face inward toward the forest. Others have partial views through trees. A small change in elevation, orientation or tree canopy can dramatically affect what a property sees.

That diversity is historically important because Skyline Forest was developed as a forest neighborhood, not simply as a line of view lots.

The trees were part of the setting from the beginning.

The Forest Became Part of Monterey's Identity

As houses spread across the ridge, Monterey faced a planning question that had not existed when most of the city's earlier neighborhoods were built.

How much development could occur before the wooded ridge stopped looking wooded?

The answer eventually became part of formal City policy.

Monterey began treating the forested upper slopes not merely as private development land but as an important scenic resource visible from throughout the city and surrounding Peninsula.

The concept became especially important during the environmental and coastal-planning movement of the 1970s.

The California Coastal Act Changes the Conversation

California adopted the Coastal Act in 1976, creating a comprehensive system for protecting coastal resources and guiding development within the coastal zone.

Monterey subsequently prepared a series of Local Coastal Program land-use plans for different parts of the city.

One of those was devoted specifically to the Skyline ridgeline.

The City's Skyline Land Use Plan was eventually certified in 1983.

Its existence tells us something important about how Monterey's attitude toward the ridge had changed.

Twenty years earlier, the fundamental question had been how to develop the hillside.

By the early 1980s, the question was how to allow development without losing the forested skyline.

Protecting Monterey's Forested Backdrop

The Skyline Land Use Plan contains unusually direct language about what the City wanted to preserve.

It calls for maintaining the continuity of Monterey's forested backdrop.

Development should not create obvious holes in the forest when viewed from surrounding areas.

New buildings were expected to remain subordinate to the scenic landscape rather than dominate it.

The plan also sought to:

  • minimize tree removal
  • replace trees removed for development
  • avoid highly visible ridgelines
  • limit alterations to natural landforms
  • protect public views
  • preserve wooded highway corridors

Those ideas continue to explain why development and tree removal in this part of Monterey require greater sensitivity than buyers might expect from an ordinary suburban neighborhood.

The 35-Foot Height Limit

The Skyline planning framework also addressed building height.

The Land Use Plan states that new structures should not exceed 35 feet and should remain in scale with their setting.

The intent was not simply to control the size of houses.

Height, massing and placement could determine whether a building appeared as part of the forest or became a dominant object on the skyline.

Holman Highway Becomes a Forest Corridor

One of the most recognizable roads associated with Skyline Forest is Holman Highway, or Highway 68.

The route winds through the wooded ridge between Monterey, Pacific Grove, Pebble Beach and Community Hospital of the Monterey Peninsula.

The City's Skyline plan identifies approximately 2½ miles of the Holman Highway corridor for special scenic treatment.

Planning policy calls for maintaining an undeveloped forested setback of at least approximately 100 feet from the highway right-of-way in the protected corridor.

The purpose is easy to understand when driving the road.

Instead of feeling like an urban arterial lined with buildings, portions of Highway 68 still pass through a continuous Monterey forest.

Skyline Drive and the Greenbelt

The same preservation philosophy applies to the greenbelt associated with Skyline Drive.

As residential development occurred, portions of the wooded corridor were preserved instead of subdivided completely.

These greenbelt areas help maintain:

  • visual separation between homes
  • wildlife habitat
  • forest continuity
  • natural drainage
  • the wooded appearance of the ridgeline

They also create an important long-term management responsibility.

The Skyline Forest Service District

The service district created in 1966 remains one of the more unusual pieces of Skyline Forest history.

Rather than depending entirely on individual homeowners to maintain common landscaping, the district established a mechanism for ongoing landscape maintenance funded by properties within the district.

City financial documents continue to carry the Skyline Forest Service District Fund decades later.

That continuity demonstrates how neighborhood landscape management was incorporated into Skyline Forest almost from the beginning of its major development era.

Huckleberry Hill: The Forest That Wasn't Developed

Immediately north of Skyline Forest is one of Monterey's most important natural areas: Huckleberry Hill Nature Preserve.

The City describes Huckleberry Hill as approximately 81 acres of natural land with established hiking trails through rare Monterey pine forest.

Pedestrian access is available through Veterans Memorial Park.

From portions of the preserve, visitors can see Monterey Bay and the surrounding coastline.

Huckleberry Hill provides an important contrast with Skyline Forest.

Both occupy the wooded ridgeline, but one became residential neighborhood while the other remained protected open space.

Veterans Memorial Park

Veterans Memorial Park lies immediately beside the broader Skyline area.

The park opened in 1967—the same period in which Skyline Forest and Skyline Crest were rapidly developing.

Its proximity added a substantial public recreational resource at the edge of the new residential neighborhoods.

Today the park provides camping, day-use areas and access toward Huckleberry Hill.

The timing is notable: residential expansion and public open-space development were occurring on Monterey's upper ridge almost simultaneously.

Skyline Forest and Skyline Ridge

The names Skyline Forest and Skyline Ridge can be confusing.

Historically and in City neighborhood programs, the names have been used for adjoining but distinguishable residential areas.

Real-estate databases frequently combine them into a single Skyline Forest/Skyline Ridge MLS area.

The distinction is less important for this historical article than understanding the larger development pattern.

Both are products of Monterey's twentieth-century expansion into the wooded upper slopes.

For buyers comparing individual streets and current listings, our Skyline Forest & Skyline Ridge real-estate guide explains the modern distinctions in greater detail.

A Neighborhood Built for the Automobile

Skyline Forest also illustrates the dramatic shift in American neighborhood planning after World War II.

Older Monterey neighborhoods were built around pedestrians, horses, streetcars and compact urban street grids.

Skyline Forest assumed residents would own cars.

That is visible in:

  • curving streets
  • cul-de-sacs
  • attached garages
  • larger setbacks
  • limited commercial activity inside the neighborhood
  • less emphasis on sidewalks

Residents could live among trees on the ridge while remaining only minutes by automobile from downtown Monterey, Pacific Grove, Pebble Beach and Carmel.

That combination was central to the appeal of postwar suburban development.

Why the Streets Curve

The curving roads are not purely aesthetic.

Hillside development requires roads to respond to topography.

Straight streets climbing directly uphill can become excessively steep, while curving roads can follow contours and reduce grading.

The pattern also created irregular building sites.

That is why two Skyline Forest homes built at approximately the same time may have completely different relationships with the street, slope and surrounding forest.

Drainage Became a Hillside Issue

Building on the upper ridge also introduced challenges that were less pronounced in flatter Monterey neighborhoods.

Water moving downhill had to be controlled.

Road cuts, driveways and building pads altered natural drainage patterns, making stormwater and erosion increasingly important planning issues.

The Skyline Land Use Plan eventually required development to address drainage and erosion so runoff from the ridge would not damage slopes or downstream areas.

This remains an important part of property ownership in the neighborhood today.

Forest Management Becomes a Permanent Responsibility

Early descriptions of Skyline Forest often presented the trees simply as an amenity.

Modern Monterey understands the forest more comprehensively.

A mature Monterey pine forest requires active management.

Trees age and die. Understory vegetation accumulates. Invasive plants appear. Storms damage trees. Drought and disease can alter the canopy.

Beginning years ago and continuing today, Monterey has funded repeated projects within Skyline Forest to:

  • remove dead and hazardous trees
  • reduce accumulated vegetation
  • remove invasive plants
  • manage wildfire fuel
  • improve access within greenbelts
  • maintain wildlife habitat where possible

Wildfire Changes How Monterey Manages the Greenbelt

Wildfire risk has made this work increasingly important.

City documents show Skyline Forest fuel-reduction projects extending back for many years.

More recently, Monterey incorporated Skyline Forest into its citywide Greenbelt Fuel Reduction Plan.

The City has obtained CAL FIRE funding to reduce hazardous vegetation in Skyline Forest and other Monterey greenbelts.

That does not change the neighborhood's wooded identity.

The goal is essentially the opposite: manage the forest so it can remain part of Monterey while reducing dangerous fuel accumulation around residential areas.

A Rare Monterey Pine Forest

The tree most closely associated with Skyline Forest is the Monterey pine.

Monterey pine is famous internationally because it has been planted commercially in many parts of the world.

Its native range, however, is remarkably limited.

The Monterey Peninsula contains one of the species' natural populations.

That makes the forest surrounding Skyline Forest more than ordinary suburban landscaping.

It is part of a native coastal forest ecosystem that has defined the Monterey Peninsula for generations.

Living With Trees—and Views

One of Skyline Forest's enduring tensions is that the two characteristics buyers often want most can conflict with one another.

People want trees.

They also want views.

Mature pines and oaks provide privacy and forest character, but the same trees may block Monterey Bay.

That tension has become part of the neighborhood's real-estate history.

The planning philosophy has generally favored retaining the forest rather than treating every tree as an obstruction to private views.

That is an important distinction from neighborhoods where open vistas are the overriding design objective.

Why Tree Removal Isn't Simply a Private Decision

Because the forested skyline is considered a broader community resource, tree removal can involve City regulation.

The Skyline Land Use Plan specifically calls for minimizing tree removal and replacing trees where development requires their loss.

That means a buyer should never assume a particular tree can be removed simply because it stands on private property or interferes with a desired view.

The individual property, species, condition and applicable City rules all matter.

The Holman Highway Roundabout

Transportation continued evolving long after Skyline Forest was built.

One of the most significant modern projects was the Holman Highway roundabout near Community Hospital of the Monterey Peninsula and the Pebble Beach entrance.

The project was intended partly to improve traffic flow and reduce the incentive for drivers to bypass congestion by cutting through Skyline Forest residential streets.

That is another reminder that the neighborhood's location is both an advantage and a challenge.

It sits beside one of the most important transportation links between Monterey, Pacific Grove, Pebble Beach and Highway 68.

Why Skyline Forest Feels Different From Monterey Below

Only a few minutes separate Skyline Forest from downtown Monterey, yet the physical experience is completely different.

The difference comes from a combination of:

  • elevation
  • curving hillside roads
  • large trees
  • greenbelts
  • larger residential lots
  • limited commercial development
  • homes positioned within the forest rather than along a grid

This contrast is one of the reasons Skyline Forest has remained a recognizable neighborhood rather than simply becoming another extension of central Monterey.

The Old Claim That Skyline Forest Is “Above the Fog”

Our original 2013 article repeated a common Monterey real-estate claim: that Skyline Forest sits high enough to be beyond the summer fog on most days.

That description is too simplistic.

Elevation absolutely affects the neighborhood's microclimate, and there are days when upper portions of Skyline Forest are sunnier than Monterey's waterfront.

But fog and low clouds can also move across the ridge itself.

Wind, elevation, tree cover and orientation create noticeable differences even within the neighborhood.

The more accurate historical observation is that Skyline Forest's elevation creates a different microclimate from the shoreline—not a reliably fog-free one.

Skyline Forest Today

More than half a century after its major development period, Skyline Forest has entered another phase.

The original 1960s and 1970s homes are now mature properties.

Some remain remarkably close to their original design.

Others have undergone major renovations incorporating larger windows, modern kitchens, expanded primary suites, updated decks and contemporary finishes.

The forest itself has matured as well.

Trees planted or retained when subdivisions were new are now enormous.

The central challenge that emerged during the neighborhood's early years therefore remains unchanged:

How do you live within a forest without gradually turning it into something that no longer feels like a forest?

Monterey has been answering that question for decades through landscape districts, greenbelts, coastal planning, tree regulations and ongoing forest management.

Skyline Forest Real Estate Today

Today's Skyline Forest/Skyline Ridge market includes detached homes, mid-century residences, remodeled properties, bay-view homes and selected attached communities.

Elevation, view quality, lot slope, architecture, driveway access and tree canopy can make two nearby properties very different from one another.

Those modern buying considerations belong in our dedicated Skyline Forest & Skyline Ridge Real Estate guide, where you can also see current MLS listings.

Skyline Forest's Place in Monterey History

Skyline Forest is important precisely because it is not ancient Monterey.

Old Town tells the story of Spanish and Mexican California.

New Monterey reflects the fishing and cannery era.

Peter's Gate grew from an artist's turn-of-the-century estate.

Alta Mesa traces its landscape plan to the Olmsted Brothers in the 1920s.

Skyline Forest tells the story of what came next.

It represents Monterey's postwar expansion into its last large wooded residential ridges—and the realization, almost immediately afterward, that continued growth could destroy the very landscape that made those ridges valuable.

The neighborhood therefore embodies two powerful twentieth-century California ideas at the same time:

suburban expansion and environmental preservation.

Frequently Asked Questions About Skyline Forest History

When was Skyline Forest developed?

Major development occurred during the 1960s and 1970s, although individual homes and later portions of the neighborhood continued developing in subsequent decades.

What was the Skyline Forest Service District?

The City of Monterey created the Skyline Forest Service District in 1966 to provide ongoing landscaping maintenance within the Skyline Forest area. Properties within the district fund the landscape program through a special tax.

When was Skyline Crest developed?

Skyline Crest No. 1, Tract 562, was recorded in Monterey County on December 13, 1967, and homes within the development were being constructed by 1968.

When was Skyline Forest No. 7 recorded?

Skyline Forest No. 7, Tract 639, was recorded on August 18, 1971. It represents one of several stages through which the broader Skyline Forest neighborhood developed.

Why are there so many 1960s and 1970s homes in Skyline Forest?

The neighborhood developed during Monterey's postwar residential expansion. Architectural styles from the period frequently emphasized ranch and contemporary design, large windows, decks, open-beam ceilings and floor plans adapted to hillside lots.

Why did Monterey create a Skyline Land Use Plan?

As development reached Monterey's upper ridge, the City increasingly recognized the wooded skyline as an important scenic and environmental resource. The Skyline Land Use Plan was developed under California's coastal-planning framework to guide development while preserving the forested ridgeline, public views and open-space corridors.

When was the Skyline Land Use Plan certified?

The City of Monterey's Skyline Land Use Plan was certified in 1983 as part of Monterey's Local Coastal Program.

What is Huckleberry Hill Nature Preserve?

Huckleberry Hill is an approximately 81-acre City of Monterey nature preserve adjacent to the Skyline area. It contains established hiking trails through native Monterey pine forest and is accessed on foot through Veterans Memorial Park.

Is Skyline Forest always above the fog?

No. Elevation can produce different weather from Monterey's immediate waterfront and can occasionally place upper areas above portions of the marine layer, but fog, low clouds and wind also reach the ridgeline.

Why does Monterey protect trees in Skyline Forest?

The forested ridge is considered part of Monterey's scenic backdrop as well as an important natural resource. City planning policies seek to minimize unnecessary tree removal, maintain the continuity of the forest and ensure that development remains subordinate to the wooded landscape.

Explore Skyline Forest and Monterey History

Skyline Forest looks mature today, but most of the neighborhood is younger than many people realize.

Its streets preserve the planning assumptions of postwar California. Its houses reflect the architecture of the 1960s and 1970s. Its greenbelts reflect the environmental movement that followed. And its mature trees now conceal much of the development that created the neighborhood in the first place.

Continue exploring:

Considering a home in Skyline Forest, Skyline Ridge or elsewhere in Monterey?
Explore current Monterey real estate or call Mark Bruno and the Monterey Peninsula Home Team at (831) 917-8190.
Aug. 13, 2013

Buy Land?

Buy Land?

Here is a pretty interesting article written by David Moore on the land for sale market accross the US after the housing market has been recovering.  David Moore, CCIM, is senior investment manager for Stratford Land in the southeastern U.S. and based in Atlanta. Contact him at dmoore@stratfordland.com.


Land
Lots of Land

The housing recovery is boosting values for parcels in many markets.

by David Moore, CCIM


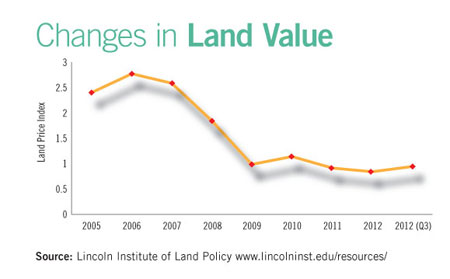
Land prices in many areas of the U.S. are on the rise amid increasing demand, but the level of demand and the reasons behind it vary from market to market. Land values increased an average of 13 percent in 2012, the first annual gain since 2005, according to housing research firm Zelman & Associates. Improvements in the housing market, modest employment growth, and population expansion in some markets are making land more attractive to investors than it has been since the housing market crashed more than four years ago. Housing demand in some markets is the single most important factor influencing land prices.

Who Is Buying?

The greatest demand is for well-located land that is ready or near-ready for residential development. Most sought after are finished lots for single-family or multifamily sites that already have roads, sewer, electric, and other infrastructure in place. Builders often find these properties to be in short supply as home construction increases.

As the housing market improves, retirement markets in the southern U.S. are heating up as many retirees — who deferred their plans due to the poor economy — can now sell their homes and relocate to new areas for retirement. For example, in Hilton Head, S.C., Stratford Land is on track to sell twice as many lots in 2013 as compared to 2012 — and at higher prices.

The U.S. Census Bureau reported in April that builders were on pace to sell 417,000 homes in 2013 and new-home construction rose 13.1 percent in the past year. The housing market has been in a slow recovery since spring 2012, but the level of recovery depends on the market.

Land investors today are combing through inventory looking for off-market opportunities with infill land for residential and commercial development. These opportunities often allow for the purchaser to have shorter hold periods and quicker returns. The Canyon in Oak Cliff, a mixed-use development in the Dallas area, is a prime example of fast-selling infill land. By proving market demand in nearby surrounding areas, Stratford Land quickly recruited multifamily, retail, hospitality, medical, and entertainment developers to serve the needs of the fast-growing local community.

In addition to a rise in homebuilding activity, land prices are being driven up in some markets by large equity funds and foreign investors. Many foreign and sovereign funds from Europe, Canada, and China are buying large U.S. land portfolios.

Farm and timber land prices are also increasing due to renewed investor activity, and Timber Investment Management Organization groups are emerging to aid institutional investors in managing their timberland investments. Timber funds are actively buying up land, particularly in southeastern states such as Georgia, Alabama, South Carolina, and Arkansas, in anticipation of rising timber prices as homebuilding continues to increase.

Demand for farmland has been strong in the last year, as high crop prices attract institutional investors. Buyers are especially interested in midwestern land: Global financial services company UBS bought 9,000 acres in Wisconsin, and financial services firm TIAA-CREF now owns 600 farms in a $4 billion fund.

Resort properties are also getting a fresh look from investors, boosting those land values, albeit more slowly than other real estate. Resort markets continue to lag behind major population centers, and land values typically remain well below their boom market peaks, but sales are picking up. The lack of new resort development over the past few years is helping to aid the more recent increase.

Hot Land Markets 

The greatest factor influencing rising land prices is housing demand, which is favoring U.S. Sun Belt cities such as Dallas, Houston, and Austin, Texas, and secondary markets with strong economies such as Orlando, Fla., Nashville, Tenn., and Charlotte, N.C.

The Texas economy has remained stronger than most of the U.S. throughout the downturn, and the prospects for land investment offer compelling opportunities in all the major markets. For example, national homebuilder Lennar is building in a number of Texas and southeastern markets.

Austin continues to be a winner in all real estate cat

egories, and home building remains strong. For land buyers who want to hold, well-priced deals are hard to come by.

Dallas-Fort Worth is experiencing strong demand for well-located land, with 44 commercial land sales of up to 25 acres during the first two months of 2013. As demand for single-family housing is strengthening, Dallas has less than three months of finished home inventory, while Fort Worth has only four months of inventory.

US Land Price Index through Q3 2012


In the glow of an energy boom, Houston land prices are high and heading higher, due to both apartment and single-family home construction in many areas, as well as the highest rate of 2012 housing starts in the U.S., according to the Real Estate Center at Texas A&M University. While less robust than other Texas cities, San Antonio is projected to see significant employment growth.

Several regional homebuilders, such as Ashton Woods, Taylor Morrison, NVR/Ryan Homes, and Ryland Homes are active in the Southeast markets of Nashville, Raleigh, N.C., Charlotte, Orlando, and Atlanta, focusing on major cities that have stable economies and strong employment. Orlando’s economy is benefiting from a tourism rebound and the retirement market. For example, Hamlin, a 600-acre residential development located just north of Walt Disney World, is experiencing strong sales due, in large part, to a new tollway that provides a gateway into western Orange County, Fla., for builders and developers.

Interest in the Charlotte market has grown with its improving economy and job growth. In the past two years, 37 companies have relocated to the city, bringing 8,000 new jobs. This trend is expected to continue as the city plans to add as many as 30,000 new jobs through 2014.

Atlanta, where the economy has historically been heavily focused on development, is just now recovering from job losses and a glut of residential inventory. Although metro Atlanta home prices continue to rise, they have yet to recover to their pre-2008 levels, creating a strong affordability index for companies choosing to relocate. In comparison to other cities of its size, Atlanta has not bounced back as quickly, and more accelerated job growth will be required to absorb the large supply of lot inventory that remains on the ground.

Elsewhere in the U.S., reports of surging housing prices don’t necessarily signal strong markets. Cities such as Detroit, Las Vegas, and Phoenix are rebounding from huge declines but still face challenges with large foreclosure inventories, high vacancy rates, and slow-to-no growth economies.

However, even in some of these weaker markets, discerning investors can find pockets of land value. For example, while the overall statistics show Phoenix as a lagging housing market, Vistancia, a 7,100-acre development located just north of Phoenix, opened an additional 3,450-acre section in response to pent-up demand. Potential buyers are anxious to view new-to-market lots in high-quality developments that had suspended growth during the bust.

In Southern California, good opportunities for longer-term land investments are possible, but they are rare and require equity positions. For example, Stratford is the lender for the Blue Sky development, a 440-unit multifamily project that recently broke ground in downtown San Diego on land the developer has owned since 2004. In 2011, Stratford became an equity partner with the developer of Millenia, located south of San Diego, to develop the $4 billion, 210-acre master-planned community over the next 20 years.

Closing Land Deals

Unless investors are cash buyers, closing land deals is challenging. Few traditional capital sources want to fund land investment, and many banks are still trying to offload land loans from their balance sheets. Some hedge funds, sovereign funds, and other institutional buyers are able to buy with all cash. Timing and availability of capital has been — and continues to be — the best way to acquire land. The ability to close quickly remains key to purchasing the best deals.

While large groups with cash are able to purchase significant tracts of land and portfolios, local purchasers looking to acquire smaller tracts have a harder time finding capital. With the absence of adequate capital to finance land transactions, smaller buyers continue to turn to private debt to close the gap. Stratford has been able to close this lending gap by providing nonrecourse land financing to a number of groups that fit this profile.

Land investing in 2013 will be active primarily for those who intend to begin construction on single-family residential or multifamily developments. The demand for these asset classes is strong in most markets, particularly those that exhibit clear signs of recovery. Land investors who are able to close sizable acquisitions during 2013 are likely to be cash buyers or the few well-capitalized investors who can secure financing.


Monterey Peninsula Real Estate

Search all Monterey Peninsula Land for Sale

Pebble Beach Real Estate - Residential Land and Home Sites for Sale.

Monterra Ranch Real Estate - Home Sites for Sale


Aug. 11, 2013

Pebble Beach Lodge Area

Pebble Beach Lodge Area

Search all Pebble Beach Lodge Area Real Estate

The Pebble Beach Lodge area includes all of the homes in Pebble Beach that are south and west of 17 Mile Drive from the Carmel Gate to Spyglass Hill Road with Stevenson Drive connecting the two. The coastline serves are the areas south and west boundary.

The Lodge area includes all of the homes built on the Pebble Beach Golf Links and Cypress Point Golf Club, as well as all of the homes built along the coastline between Carmel Gate and Spyglass Hill Road where it meets the Pacific Ocean. This area also includes the “dunes” portion of Spyglass Hill Golf Course (the part of the course that is south of Spyglass Hill Road), Peter Hay Golf Course and the prestigious Lodge at Pebble Beach.

Pebble Beach Lodge Area Real Estate

Pebble Beach Lodge area real estate represents the most expensive real estate available inside the exclusive gates of Pebble Beach. If you are looking for a Pebble Beach luxury home for sale in one of the most recognized high end luxury communities in the world, the lodge area real estate is what you want to purchase. Homes inside the Pebble Beach Lodge neighborhood generally start above $1,000,000.00 US and are estimated as high as $40M+. Recently a contemporary style luxury home on Stillwater Cove just a couple of homes north of the Pebble Beach Lodge sold for $28,000,000, and an oceanfront home on the Cypress Point side of the Pebble Beach Lodge area sold for $22,000,000.

Pebble Beach Lodge Area Homes for Sale

The Lodge area of Pebble Beach includes some of the most luxurious and spectacular homes on the Monterey Peninsula. Some of the luxury homes in this part of Pebble Beach are built right on the edge of the Pacific Ocean making them some of the most sought after oceanfront properties in the world! Other homes are built on either Pebble Beach Golf Links or Cypress Point Golf Club, two of the most desirable gold course in the world! And still other homes are built on home sites with amazing Pebble Beach ocean views of Point Lobos, Stillwater Cove, Carmel Beach, and the Pacific Ocean…Not to mention breathtaking views of some of the most famous golf holes in the world. If you are looking for a truly unique and luxurious piece of real estate, the Lodge area of Pebble Beach might just be what you are after.

To see the latest 3 real estate listings of Pebble Beach Lodge neighborhood homes for sale, click here.  For a full list of Pebble Beach Lodge Neighborhood homes for sale that are available, you can build an advanced search or contact us and we can do it for you.

Our website has detailed information including Pebble Beach Lodge real estate statistics.  If you are interested in learning more about real estate values in this Pebble Beach, CA neighborhood or if you are interested in seeing Pebble Beach homes that are for sale in the Country Club West area, contact us.

Aug. 6, 2013

Monterey Peninsula Real Estate Reality Check - August, 2013

Monterey Peninsula Real Estate Reality Check - August, 2013

Underwater Mortgages Decline as Home Price Rise

Leaving More Monterey Peninsula Home Owners in a position to Sell

Rising home prices over the past couple of years are reducing the number of homeowners who are “underwater” in their mortgage, bringing more potential sellers off the sidelines to take advantage of the robust housing market.

That’s good news for hundreds of thousands of homeowners across the country, but the trend also provides relief for many frustrated buyers who have been fighting over the limited inventory of homes on the market.

Being “underwater” or “upside down” on a mortgage means that homeowners owe more on their loans than their properties are worth – often referred to as having “negative equity.” The result is that these homeowners can find it extremely difficult to sell their property, especially if they’re trying to buy another home.

Underwater mortgages grew during the recession and the housing downturn. According to CoreLogic, which tracks underwater mortgages nationwide, more than one out of every four homeowners nationwide owed more on their home than it was worth in 2010.

But that trend is changing quickly, and homeowners who thought they were underwater might be surprised to learn they no longer are.

“The impressive home price gains of 2012 and the beginning of 2013 have had a big impact on the distribution of residential home equity,” said Dr. Mark Fleming, chief economist for CoreLogic. “During the past year, 1.7 million borrowers have regained positive equity.”

Dr. Fleming called the decline in underwater mortgages “a virtuous circle” in a recent Associated Press article. “The fact that house prices have increased so dramatically ... has unlocked a lot of that pent-up supply,” he said.

According to CoreLogic, at the end of March, 19.8 percent of the nation’s mortgaged homes were underwater, down from 23.7 percent a year earlier and 25 percent during the same period of 2011.

The improvement has been seen in every region of the country, although it varies by location. While some states and cities are doing much better than average, others that experienced the strongest price increases and sharpest drop-off during the recession have a higher percentage of underwater mortgages.

California as a whole is slightly above the national average with 21.3 percent of homeowners having negative equity. But that’s down sharply from 30.5 percent just a year ago. The Bay Area was 22.6 percent in the first quarter, while the Sacramento metro area was 25.8 percent, although both regions have seen a drop in over the past year.

How do we compare with the rest of the country? Here are some findings:

Nevada had the highest percentage of mortgaged properties in negative equity during the first quarter of the year at 45.4 percent, followed by Florida (38.1 percent), Michigan (32 percent), Arizona (31.3 percent) and Georgia (30.5 percent).

On the other end of the spectrum, Montana had the highest percent of homeowners with positive equity at 94.4 percent, followed by North Dakota (94.1 percent), Alaska (93.9 percent), Texas (92.8 percent), and Wyoming (92.6 percent).

Of the largest 25 metropolitan areas, Tampa-St. Petersburg-Clearwater, Florida had the highest percentage of mortgaged properties in negative equity at 41.1 percent, followed by the Miami area (40.7 percent), Atlanta (34.5 percent), Chicago (34.2 percent) and the Warren-Troy-Farmington Hills, Michigan metro area (33.6 percent).

The inventory of homes for sale across the country has fallen over the past year. According to the National Association of Realtors®, there was a 5.2-month supply of existing, single-family homes for sale in May, compared to 6.4 months a year earlier. And inventory is even lower in many of our Bay Area communities.

So if you’ve been thinking about selling your home, this may be a good time to make your move and take advantage of this strong seller’s market. Your home may have more equity than you think. I’m ready to answer any questions you may have about selling your home and the best ways to get the most for your property. Give me a call and we’ll get started today. 

Mark Bruno
Monterey Peninsula Home Team
mark.bruno@cbnorcal.com
(831) 626-2277
 
Aug. 1, 2013

The Butterfly House in Pacific Grove, CA

The Butterfly House in Pacific Grove, CA

Butterfly House in Pacific Grove, CA

Bright colors, extravagant beauty and butterflies; butterflies of all shapes and sizes. Located at 309 9th street in Pacific Grove this magnificently colored house is hard to miss. It is a wonder to all ages young and old with the flow of its brightly colored butterflies from the widely known Monarchs down to the smaller Cracker butterflies. Ironically, Pacific Grove is known for being the “Butterfly Capital of California” so it is not that uncommon to spot many of these glamorous insects as one strolls the street. 

Pacific Grove Butterfly HouseThe colors and patterns that make this Pacific Grove house extraordinary all come from the brilliant creativity of J Jackson. The owner, J Jackson, sculpted this master piece after he found out that his loving wife Sonia was diagnosed with the eye disease Retinitis Pigmentosa. He was later informed that this disease would leave Sonia unable to see anything but very bright colors. So, being her loving husband, J picked up his brush and let out the artist within.

Their house has become a must see while visiting Pacific Grove.  Attached on and around the house lies more than one thousand butterflies, that appears to delicately flutter on the outside of their home. This place is perfect for creating childhood memories that  last a lifetime. Every color you could imagine fills the outside of their house; from bright oranges and yellows, to the vast purples and reds that are surely bound to follow you on this breath taking adventure.

Pacific Grove Butterfly House detailsPictures are welcome here at this colorful Pacific Grove home and  it would be a shame not to bring your camera. Aside from the Monterey Bay Aquarium, this little house is a definite must for the whole family to enjoy. Especially on a warm sunny day, these magnificent butterflies always seem to bring out the beauty in what nature has to offer.
Living in Pacific Grove for more than four years, I have seen much of this little city’s wonders. While nothing surprises me much anymore, this little house on 9th street always seems to brighten my day on any bad occasion. But don’t take it from me, see for yourself. 

Written by Pacific Grove High School student, Noa Umbaugh for MPHTBlog.com.

More info on the City of Pacific Grove

Search all Pacific Grove real estate.

July 31, 2013

Carmel Woods Neighborhood of Carmel

Carmel Woods Neighborhood of Carmel, CA

Carmel Woods is located at the Northern most tip of Carmel, CA just west of Hwy 1 and borders Pebble Beach’s 17 Mile Drive from the Hwy 1 Gate down Pescadero Canyon. The Carmel Woods neighborhood expands over both sides of Carpenter Street and is bordered on the south by Pescardero Road, Serra Rd and Valley Way. Carmel Woods is heavily forested with Monterey pines, oak and cypress trees and the terrain in this portion of Carmel is relatively steep. The roads for the entire neighborhood seem to snake around the mountainous terrain like a roller coaster ride, with ups and downs and rolling turns, making it feel like you are in a more rural setting than you really are.

Being near the top of Pescadero Canyon and one of the highest points in Carmel, CA, Carmel Woods offers some exceptional ocean views with Pescadero Point in Pebble Beach being visible in certain areas as well as Point Lobos, Carmel Bay and the Pacific Ocean. Although most of the Carmel Woods area offers just peaks of the water, the area near Upper Trail offers magnificent views of Point Lobos and Carmel Point, making it a desirable place to own real estate.

Carmel Woods Real Estate

Carmel Woods real estate is a popular area for local Monterey Peninsula residents based on its proximity to all local cities and due to the fact it is in Carmel school district, which is one of the highest ranked school systems in the area. Although generally thought of as a more affordable neighborhood of Carmel, CA, many Carmel Woods luxury homes have views of either the Pacific Ocean, Carmel Bay or Point Lobos, which obviously increases the desirability and value of real estate in this neighborhood. Homes in Carmel Woods range from small Carmel cottages to larger Carmel luxury homes, and everything in between. Prices can be as low at $500,000 and as high as $5,000,000 for a piece of Carmel Woods ocean view real estate!

This area is known for many of the homes being built on the hilly, heavily forested terrain with Monterey pine trees and oak trees everywhere. If you are looking for a grid of homes, Carmel Woods will not be for you as the roads are all curvy with lots of elevation changes. Don’t be surprised if you get lost the first few times you drive around Carmel Woods, but since it is not a very large area, it won’t take long to master it.

Be sure to check out our Carmel Woods real estate statistics page if you are interested in learning more about real estate values in Carmel Woods. If you are interested in viewing homes for sale in the Carmel Woods area, or if you have questions about purchasing a home here, contact us.

July 29, 2013

Central Pebble Beach Neighborhood

Central Pebble Beach Neighborhood

Central Pebble Beach real estate is some of the most highly sought after real estate in all of Pebble Beach, second only to the Pebble Beach Lodge area real estate, which is located around the world renowned Pebble Beach Lodge. Central Pebble Beach neighborhood is located in the central part of Pebble Beach with Spyglass Hill Golf Course and Poppy Hills Golf course as well as Stevenson's Upper School within its boundary. 17 Mile Drive along Pebble Beach Golf Links serves as its southern edge, 17 Mile Drive between Birdrock Rd. and Spyglass Hill Rd. is the western border and the border to the north is primarily open space up to the Morse Gate in Pacific Grove. The majority of the dedicated open space inside Pebble Beach lies inside the Central Pebble Beach boundaries.

Central Pebble Beach Neighborhood Real Estate

Real Estate inside Central Pebble Beach is very diverse and can be quite expensive. It is not uncommon to see homes in the lower sections of Central Pebble Beach near Pebble Beach Golf Links and the Pebble Beach Lodge as well as the Macomber Estates area coming on the market in the $20,000,000 range. The upper part of Central Pebble Beach will see the lowest real estate prices around $850,000 with the majority of homes in the $1,000,000 to $2,500,000 price range. Homes inside the Central Pebble Beach neighborhood will vary in size from as little as 1500 square feet to over 10,000 square feet.

If you are looking for a Central Pebble Beach Ocean view home, there are normally several to choose from, however be prepared to bust the piggy bank! Central Pebble Beach real estate has some of the best ocean view homes in all of Pebble Beach due to the steep terrain and the angle it has on Point Lobos, Stillwater Cove, Carmel Bay and Carmel's white sand beach. Specifically Del Ciervo Road, Crespi Lane, Macomber Drive, Riata Road and Bonafacio Road are the ones to watch. Many homeowners love this view as it is similar to the View The Pebble Beach Lodge has, but it is from a higher angle and in most cases also offers a view of Pebble Beach Golf Links.

Be sure to check out our Central Pebble Beach real estate statistics page if you are interested in learning more about real estate values in Central Pebble Beach. If you are interested in viewing homes for sale in the Central Pebble Beach area, or if you have questions about purchasing a home here, contact us.

July 26, 2013

Pebble Beach Real Estate Market Trends - June 2013

Pebble Beach Real Estate Market Trends - June 2013

Check out the Pebble Beach Real Estate market trends report for June, 2013 below.  This site has every single Carmel Home and piece of real estate for sale on it.  All you have to do is sign up to receive new Carmel Real Estate Listings via a daily email...for free.  And as always, be sure to contact us if you have any questions about anything you see on our site.


Pebble Beach Real Estate Property Sales

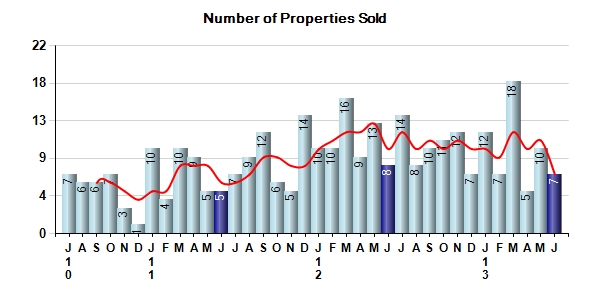
Pebble Beach Real Estate number of properties sold June 2013

June property sales were 7, down from 8 in June of 2012 and -30.0% lower than the 10 sales last month. June 2013 sales were at a mid level compared to June of 2012 and 2011. June YTD sales of 59 are running -10.6% behind last year's year-to-date sales of 66.


Pebble Beach Real Estate Prices

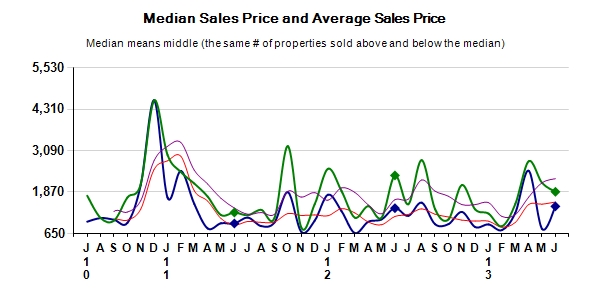
Pebble Beach Real Estate Prices

The median sales price in June was $1,450,000, up 3.8% from $1,397,500 in June of 2012 and up 84.7% from $785,000 last month. The average sales price in June was $1,879,714, down -20.4% from $2,362,125 in June of 2012 and down -12.2% from $2,141,095 last month. June 2013 ASP was at a mid range compared to June of 2012 and 2011.


Pebble Beach Real Estate Inventory & Months Supply of Inventory (MSI)

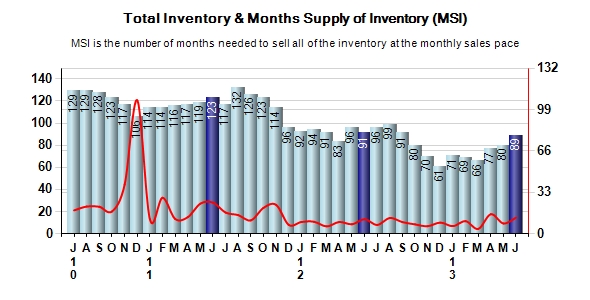
Pebble Beach Real Estate Inventory & Months Supply of Inventory (MSI)

The total inventory of properties available for sale as of June was 89, up 11.3% from 80 last month and down -2.2% from 91 in June of last year. June 2013 Inventory was at the lowest level compared to June of 2012 and 2011.

A comparatively lower MSI is more beneficial for sellers while a higher MSI is better for buyers. The June 2013 MSI of 12.7 months was at a mid range compared with June of 2012 and 2011.


Pebble Beach Real Estate Market Time

Pebble Beach Real Estate Market Time

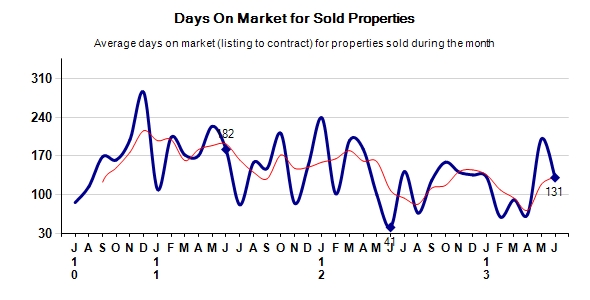
The average Days On Market (DOM) shows how many days the average property is on the market before it sells. An upward trend in DOM tends to indicate a move towards more of a buyer's market, a downward trend a move towards more of a seller's market. The DOM for June was 131, down from 201 days last month and up from 41 days in June of last year. The June 2013 DOM was at a mid range compared with June of 2012 and 2011.


Pebble Beach Real Estate Selling Price Per Square Foot

Pebble Beach Real Estate Selling Price Per Square Foot

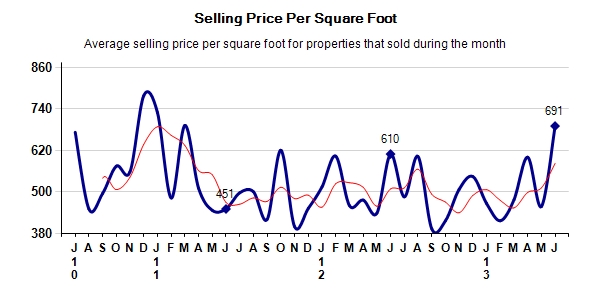
The selling price per square foot is a great indicator for the direction of property values. Since median sales price and average sales price can be impacted by the 'mix' of high or low end properties in the market, the selling price per square foot is a more normalized indicator on the direction of property values. The June 2013 selling price per square foot of $691 was up 50.9% from $458 last month and up 13.3% from $610 in June of last year. 


Pebble Beach Real Estate Selling Price vs Listing Price

Pebble Beach Real Estate Selling Price vs Listing Price

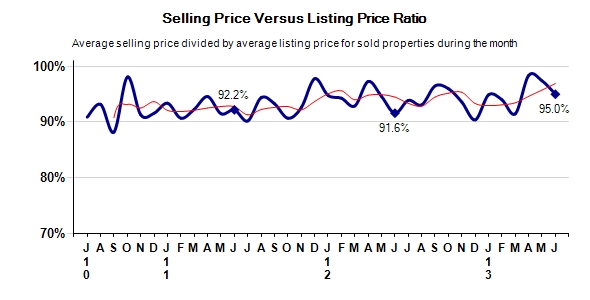
The selling price vs listing price reveals the average amount that sellers are agreeing to come down from their list price. The lower the ratio is below 100% the more of a buyer's market exists, a ratio at or above 100% indicates more of a seller's market. The June 2013 selling price vs list price of 95.0% was down from 97.4% last month and up from 91.6% in June of last year. 


Pebble Beach Real Estate Inventory / New Listings / Sales


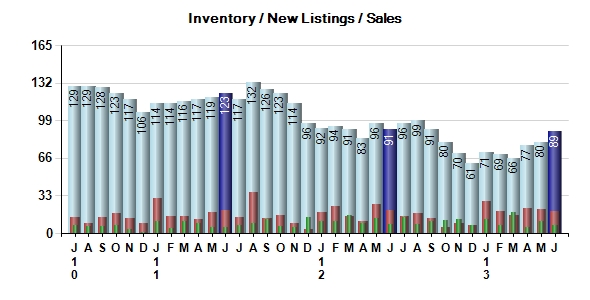
This last view of the market combines monthly inventory of properties for sale along with new listings and sales. The graph shows the basic annual seasonality of the market as well as the relationship between these items. The number of new listings in June 2013 was 19, down -9.5% from 21 last month and down -5.0% from 20 in June of last year. 

July 24, 2013

Carmel Real Estate Market Trends - June 2013

Carmel Real Estate Market Trends - June 2013

Check out the Carmel Real Estate market trends report for June, 2013 below.  This site has every single Carmel Home and piece of real estate for sale on it.  All you have to do is sign up to receive new Carmel Real Estate Listings via a daily email...for free.  And as always, be sure to contact us if you have any questions about anything you see on our site.


Carmel Real Estate Property Sales

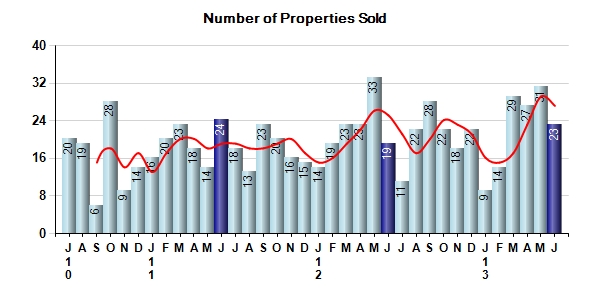
Carmel Real Estate number of properties sold

June property sales were 23, up from 19 in June of 2012 and -25.8% lower than the 31 sales last month. June 2013 sales were at a mid level compared to June of 2012 and 2011. June YTD sales of 133 are running 1.5% ahead of last year's year-to-date sales of 131.


Carmel Real Estate Median Price and Average Price

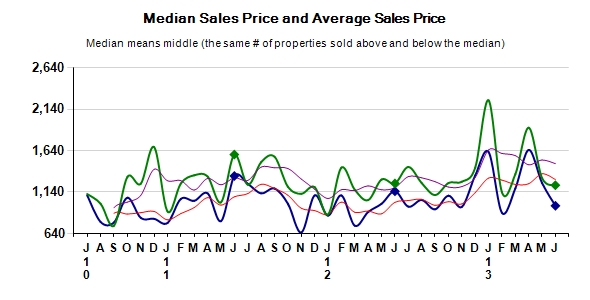
Carmel Real Estate Median Price and Average Price

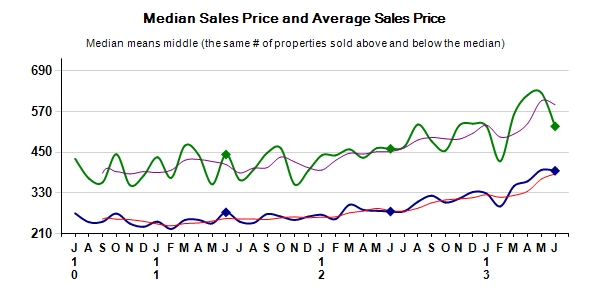
The median sales price in June was $975,000, down -15.2% from $1,150,000 in June of 2012 and down -22.0% from $1,250,000 last month. The average sales price in June was $1,222,957, down -1.8% from $1,245,342 in June of 2012 and down -6.6% from $1,308,968 last month. June 2013 ASP was at the lowest level compared to June of 2012 and 2011.


Carmel Real Estate Inventory Levels & Monthly Supply of Inventory (MSI)

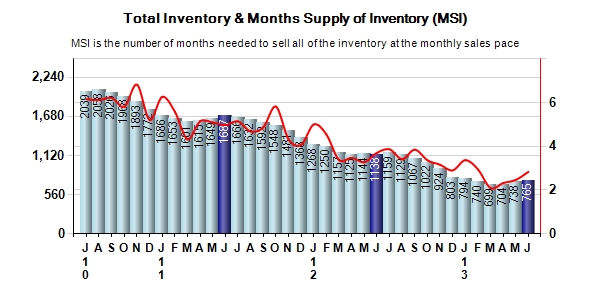
Carmel Real Estate Inventory Levels

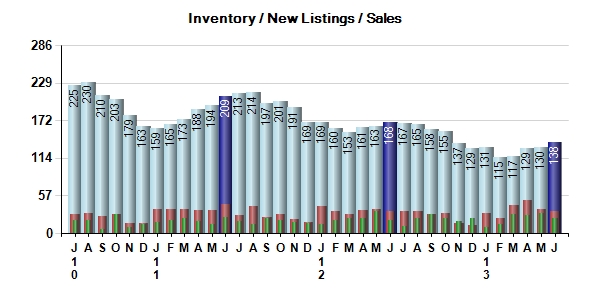
The total inventory of properties available for sale as of June was 138, up 6.2% from 130 last month and down -17.9% from 168 in June of last year. June 2013 Inventory was at the lowest level compared to June of 2012 and 2011.

A comparatively lower MSI is more beneficial for sellers while a higher MSI is better for buyers. The June 2013 MSI of 6.0 months was at its lowest level compared with June of 2012 and 2011.


Carmel Real Estate Days on Market for Sold Properties

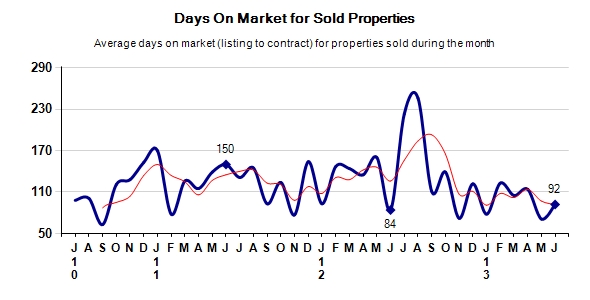
Carmel Real Estate Days on Market for solds

The average Days On Market (DOM) shows how many days the average property is on the market before it sells. An upward trend in DOM tends to indicate a move towards more of a buyer's market, a downward trend a move towards more of a seller's market. The DOM for June was 92, up from 71 days last month and up from 84 days in June of last year. The June 2013 DOM was at a mid range compared with June of 2012 and 2011.


Carmel Real Estate Selling Price Per Square Foot

Carmel Real Estate price per square feet

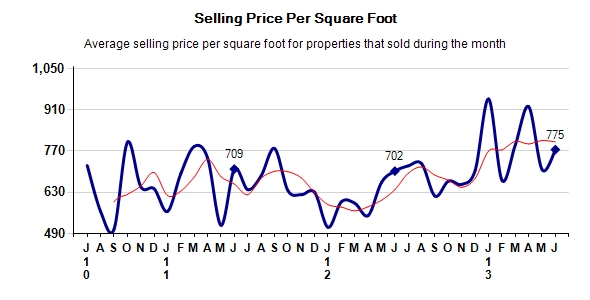
The selling price per square foot is a great indicator for the direction of property values. Since median sales price and average sales price can be impacted by the 'mix' of high or low end properties in the market, the selling price per square foot is a more normalized indicator on the direction of property values. The June 2013 selling price per square foot of $775 was up 9.6% from $707 last month and up 10.4% from $702 in June of last year. 


Carmel Real Estate Selling Price vs Listing Price

Carmel Real Estate Selling price Versus List price

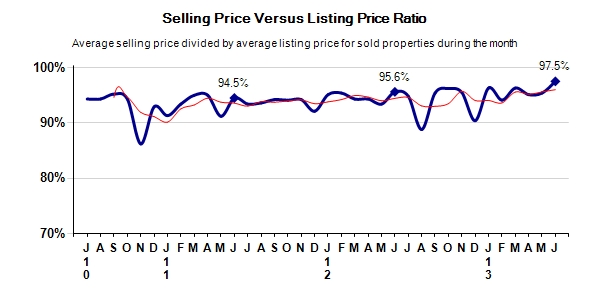
The selling price vs listing price reveals the average amount that sellers are agreeing to come down from their list price. The lower the ratio is below 100% the more of a buyer's market exists, a ratio at or above 100% indicates more of a seller's market. The June 2013 selling price vs list price of 97.5% was up from 95.4% last month and up from 95.6% in June of last year. 


Carmel Real Estate Inventory / New Listings / Sales

Carmel Real Estate Inventory/New Listings/Sales

This last view of the market combines monthly inventory of properties for sale along with new listings and sales. The graph shows the basic annual seasonality of the market as well as the relationship between these items. The number of new listings in June 2013 was 34, down -8.1% from 37 last month and equal to 34 in June of last year. 

July 23, 2013

Monterey County Real Estate Market Trends

Monterey County Real Estate Market Trends - JUNE 2013

Monterey County Property Sales

Monterey County Real Estate Number of Properties Sold

June property sales were 261, down from 297 in June of 2012 and -10.0% lower than the 290 sales last month. June 2013 sales were at their lowest level compared to June of 2012 and 2011. June YTD sales of 1,640 are running -8.4% behind last year's year-to-date sales of 1,791.


Monterey County Real Estate Prices

Monterey County Real Estate Prices

The median sales price in June was $395,000, up 43.6% from $275,000 in June of 2012 and down -0.6% from $397,475 last month. The average sales price in June was $526,187, up 14.4% from $459,970 in June of 2012 and down -15.8% from $625,044 last month. June 2013 ASP was at highest level compared to June of 2012 and 2011.


Monterey County Real Estate Inventory & Months Supply of Inventory (MSI)

Monterey County Real Estate Inventory Snapshot

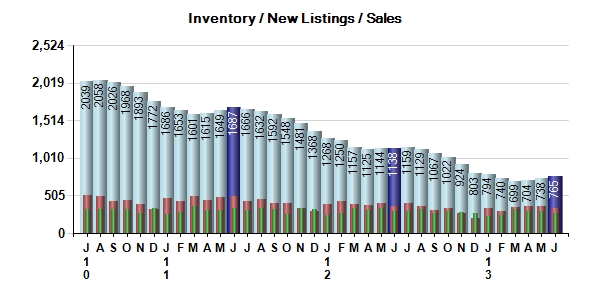
The total inventory of properties available for sale as of June was 765, up 3.7% from 738 last month and down -32.8% from 1,138 in June of last year. June 2013 Inventory was at the lowest level compared to June of 2012 and 2011.

A comparatively lower MSI is more beneficial for sellers while a higher MSI is better for buyers. The June 2013 MSI of 2.9 months was at its lowest level compared with June of 2012 and 2011.


Monterey County Real Estate Days on Market for Sold  Real EstateMonterey County Days on Market for Sold Property

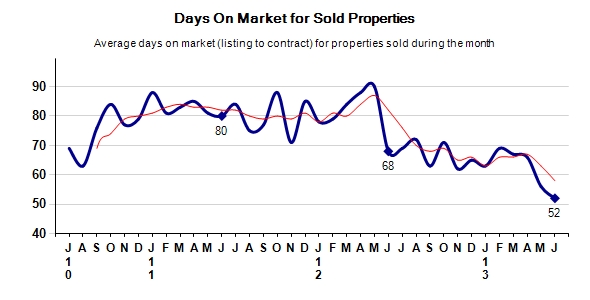
The average Days On Market (DOM) shows how many days the average property is on the market before it sells. An upward trend in DOM tends to indicate a move towards more of a buyer's market, a downward trend a move towards more of a seller's market. The DOM for June was 52, down from 56 days last month and down from 68 days in June of last year. The June 2013 DOM was at its lowest level compared with June of 2012 and 2011.


Monterey County Real Estate Selling Price Per Square Foot

Monterey County Real Estate Selling Price Per Square Foot

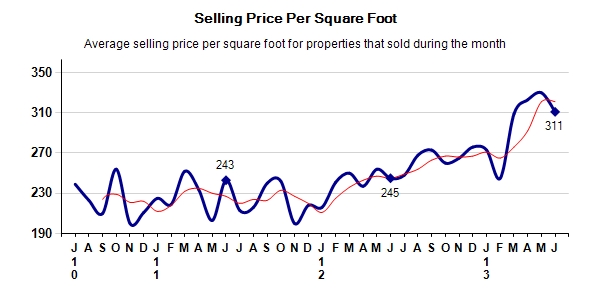
The selling price per square foot is a great indicator for the direction of property values. Since median sales price and average sales price can be impacted by the 'mix' of high or low end properties in the market, the selling price per square foot is a more normalized indicator on the direction of property values. The June 2013 selling price per square foot of $311 was down -5.8% from $330 last month and up 26.9% from $245 in June of last year. 


Monterey County Real Estate Selling Price vs Listing Price

Monterey County Real Estate Selling Price vs Listing Price

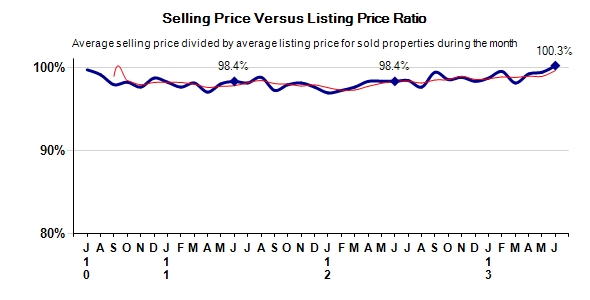
The selling price vs listing price reveals the average amount that sellers are agreeing to come down from their list price. The lower the ratio is below 100% the more of a buyer's market exists, a ratio at or above 100% indicates more of a seller's market. The June 2013 selling price vs list price of 100.3% was up from 99.5% last month and up from 98.4% in June of last year. 


Monterey County Real Estate Inventory / New Listings / Sales

Monterey County Real Estate Inventory / New Listings / Sales

This last view of the market combines monthly inventory of properties for sale along with new listings and sales. The graph shows the basic annual seasonality of the market as well as the relationship between these items. The number of new listings in June 2013 was 340, down -7.1% from 366 last month and down -5.6% from 360 in June of last year. 


Based on information from MLSListings, Inc. for the period 1/1/2005 through 6/30/2013. Due to MLS reporting methods and allowable reporting policy, this data is only informational and may not be completely accurate. Therefore, Coldwell Banker Residential Brokerage does not guarantee the data accuracy. Data maintained by the MLS's may not reflect all real estate activity in the market. This information will expire 30 days from when it was generated.